 BARACUDA TRADE
Awesome Oscillator
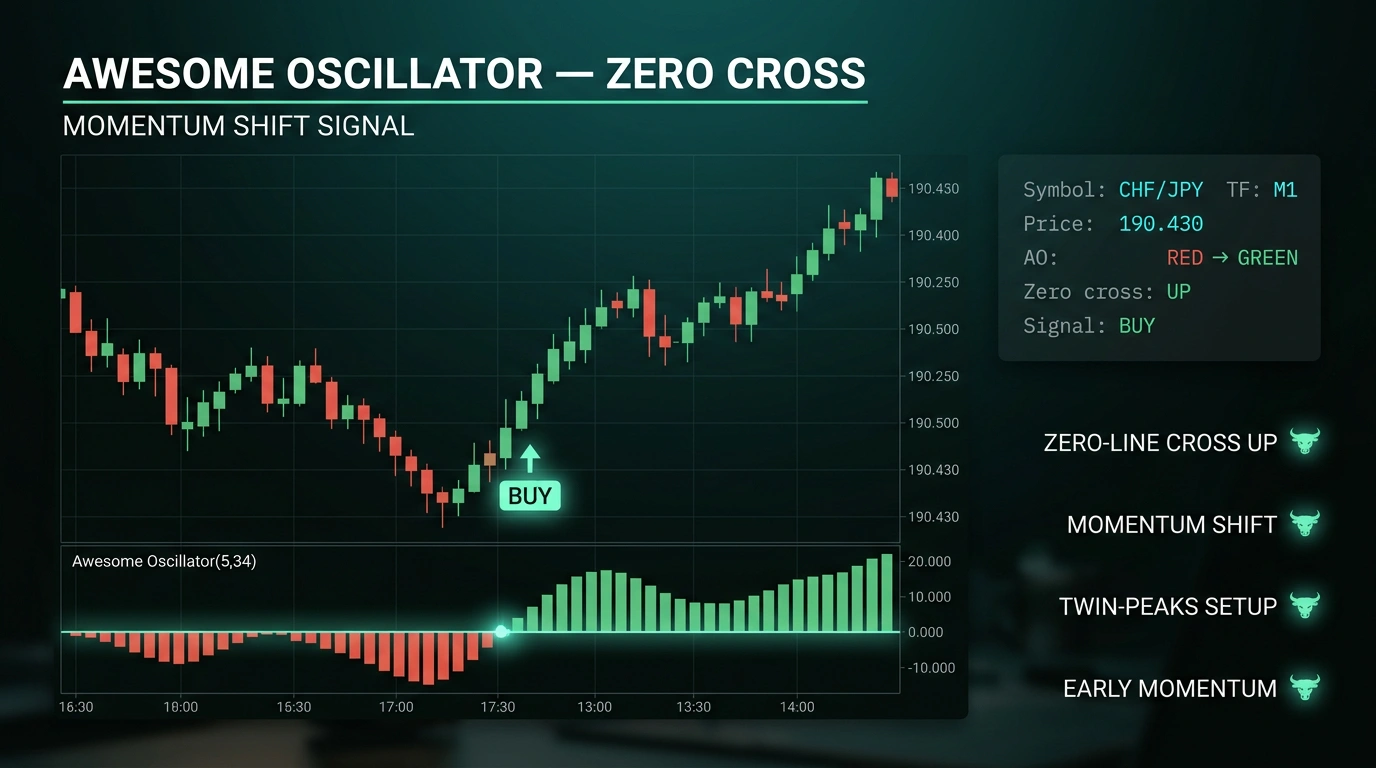
Awesome Oscillator — гистограмма, которая показывает импульс рынка. Бары выше нуля (зелёные) — бычий импульс, ниже (красные) — медвежий. Пересечение нулевой линии снизу вверх — сигнал на покупку (сверху вниз — на продажу).
The Awesome Oscillator is a histogram that shows market momentum. Bars above zero (green) are bullish, below (red) are bearish. A zero-line cross from below to above is a buy signal (above to below is a sell).
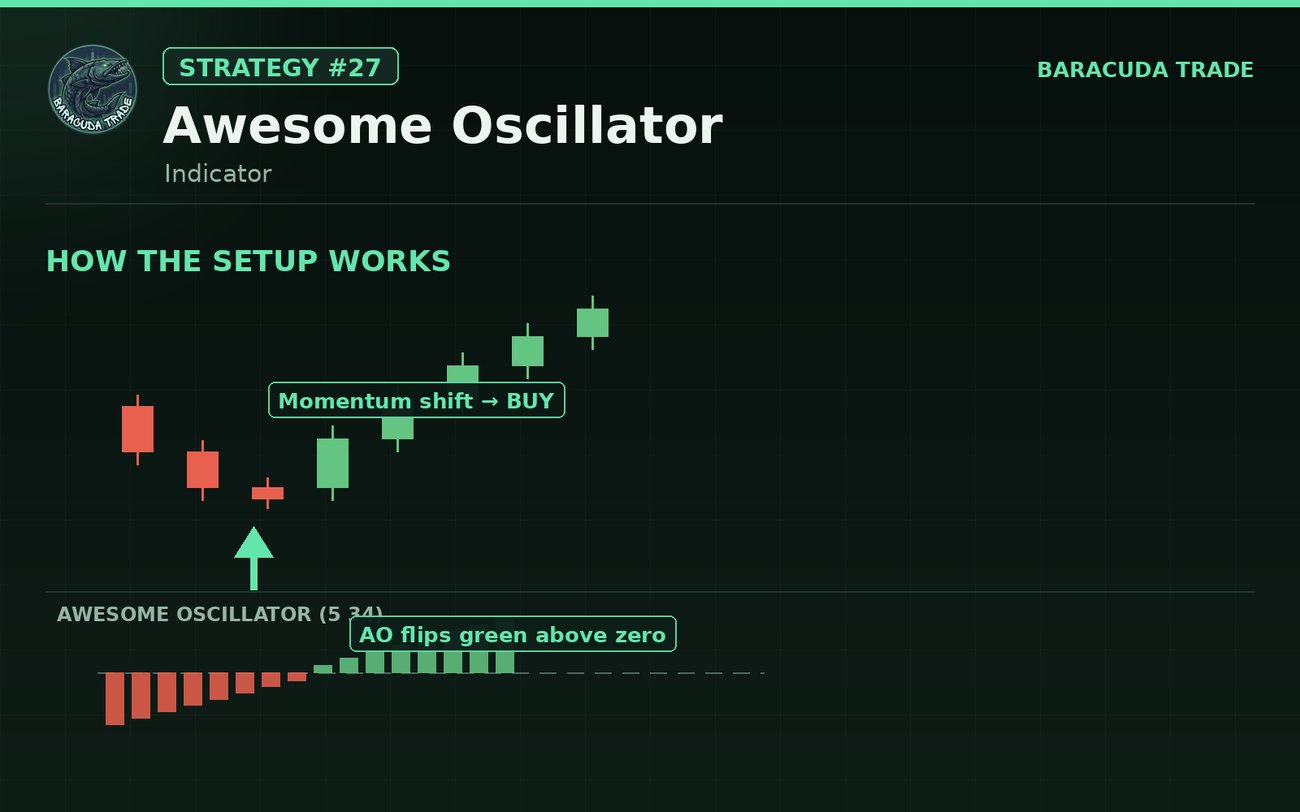
Схема: гистограмма AO переходит из красной под нулём в зелёную над нулём.
Schematic: the AO histogram flips from red below zero to green above zero.
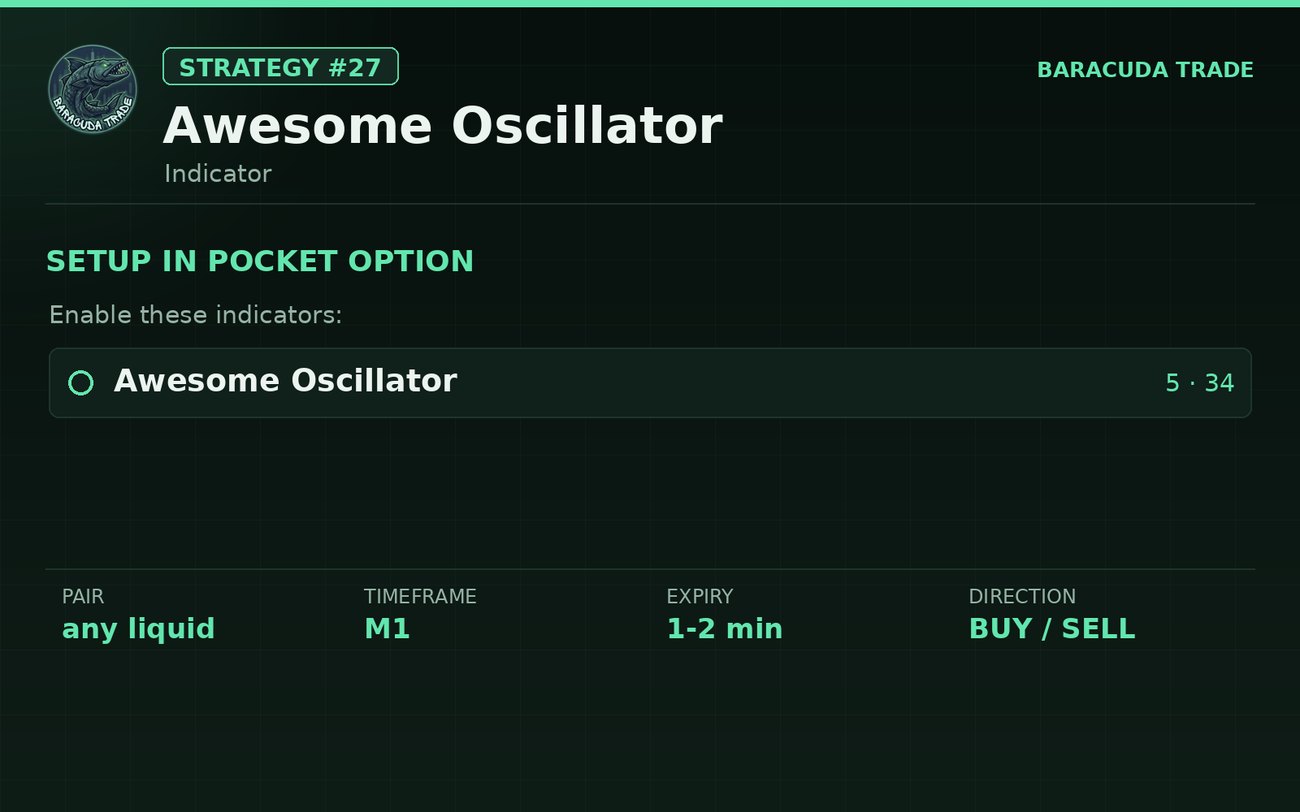
Включи Awesome Oscillator (5·34). Следим за пересечением нулевой линии.
Enable Awesome Oscillator (5·34). Watch the zero-line cross.
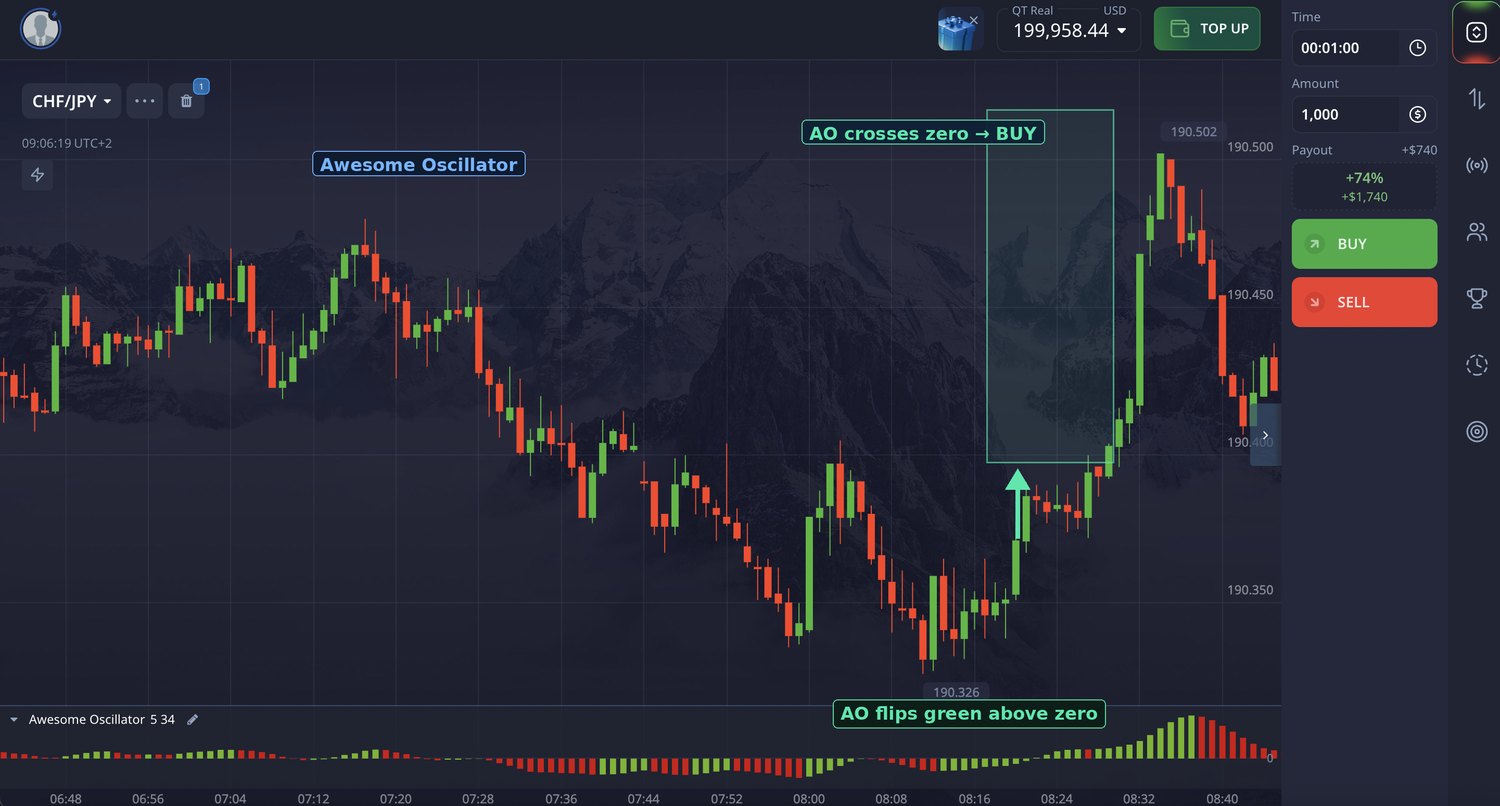
На реальном графике: AO пересёк ноль вверх (красный→зелёный) — импульс вверх, вход BUY.
On a real chart: AO crossed zero up (red→green) — up momentum, a BUY entry.
- Включи Awesome Oscillator (5·34).Enable Awesome Oscillator (5·34).
- Следи за цветом и стороной баров относительно нуля.Watch the bar colour and side vs zero.
- Жди пересечения нуля: вверх = BUY, вниз = SELL.Wait for a zero cross: up = BUY, down = SELL.
- Подтверди импульс ценой на графике.Confirm the momentum on price.
- Вход по направлению пересечения (BUY/SELL).Enter in the cross direction (BUY/SELL).
Если бары мелкие и «пилят» вокруг нуля — импульса нет, сигнал пропускаем.
If the bars are tiny and chop around zero — no momentum, skip the signal.